Equipment & Asset Utilization
Location: Dashboards → Asset Utilization
Track equipment usage, idle time, and utilization metrics across your fleet. All data is based on accelerometer movement detection from Wirepas EverTag sensors.
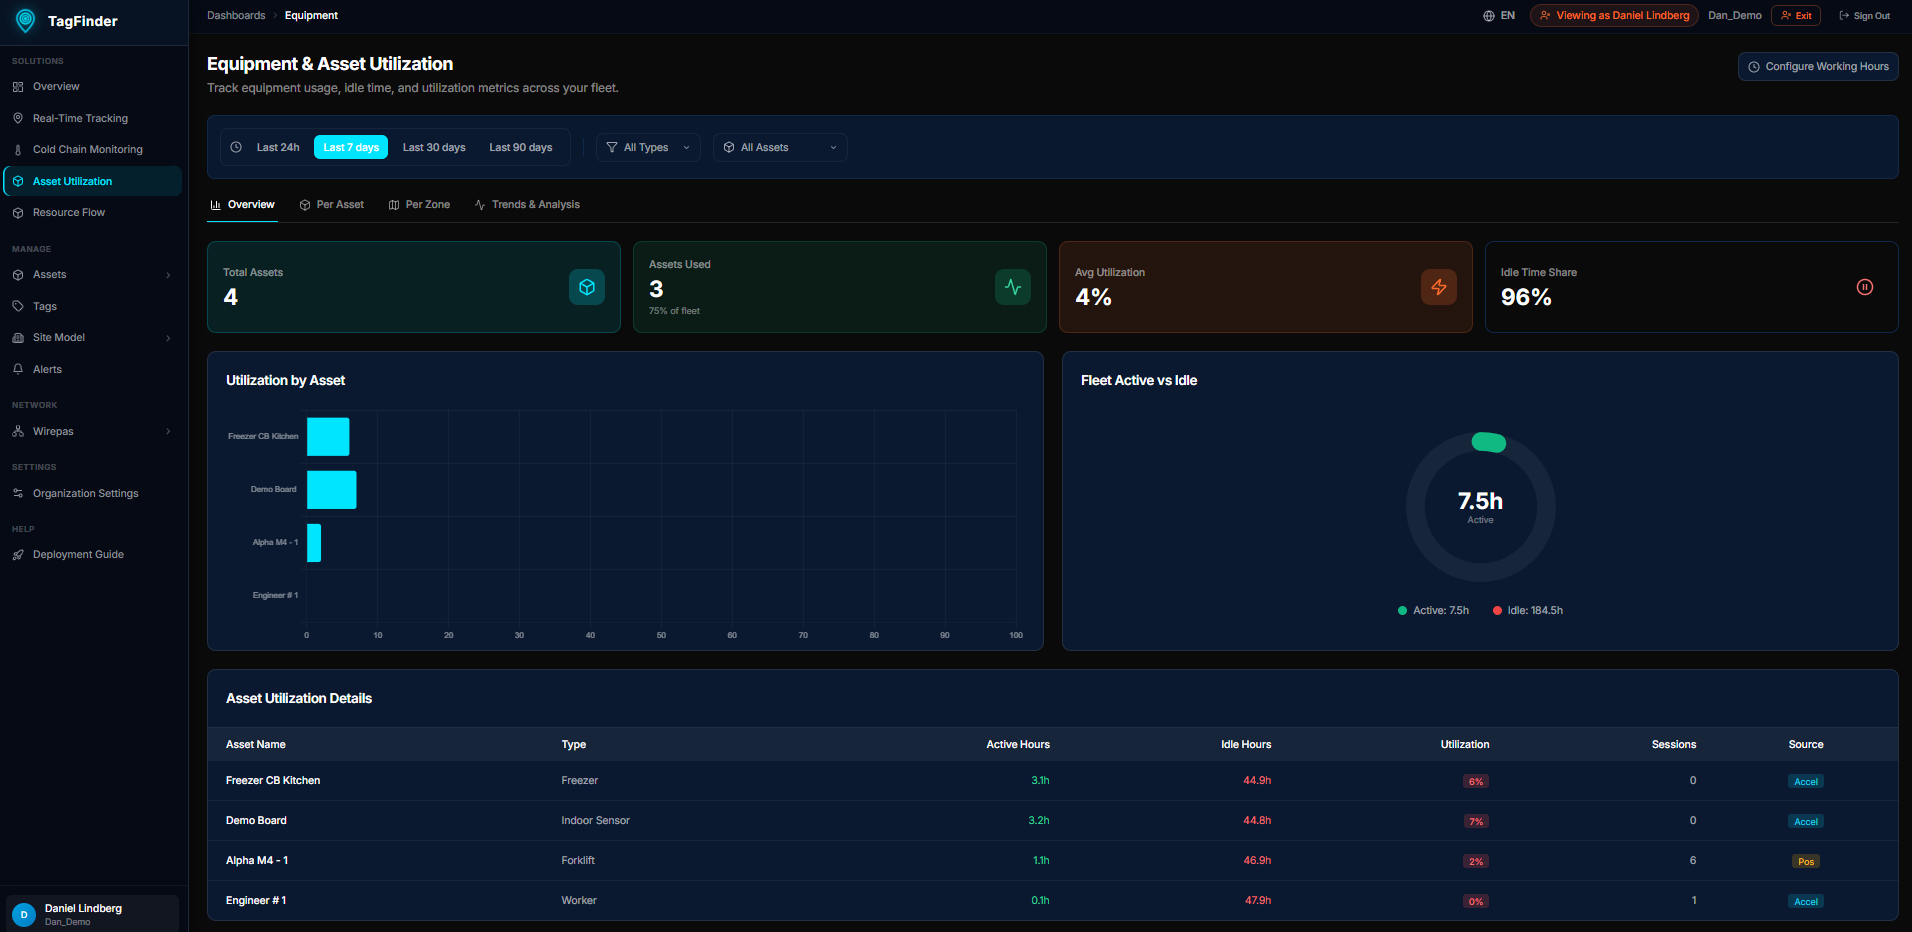 The Equipment dashboard showing fleet KPIs, utilization chart, and asset table.
Overview Tab
Fleet-level summary with four KPI cards:
| KPI | What it shows |
|---|---|
| Total Assets | Number of assets (filtered by selected type) |
| Assets Used | Assets with detected movement in the period |
| Avg Utilization | Active Hours ÷ Available Working Hours × 100% |
| Idle Time Share | Percentage of working hours with no movement |
Charts:
- Utilization by Asset — top 10 assets ranked by utilization rate. Hover for exact percentage.
- Fleet Active vs Idle — donut chart showing the split between total active and idle hours.
Asset Utilization Details table — every asset with Active Hours, Idle Hours, Utilization %, Sessions, and data source (Accel or Pos). Click any row to drill into Per Asset details.
Per Asset Tab
When no asset is selected, shows a fleet comparison:
- Active vs Idle by Asset — stacked horizontal bars. Click a bar to select that asset.
- All Assets table — click a row to see daily details.
When an asset is selected, shows its individual breakdown:
- KPI cards — Active Hours, Idle Hours, Utilization %, Movement Sessions
- Daily Active vs Idle — stacked bar chart by date
- Daily Utilization Rate — line chart of utilization % over time
Per Geofence Tab
Shows how much time assets spent in each geofence zone.
| Column | Description |
|---|---|
| Geofence | Zone name |
| Type | Geofence category (Storage, Office, etc.) |
| Total time | Time spent inside this geofence, from consecutive position intervals |
| Active time | Accelerometer movement time, prorated by zone share |
| Assets | Number of distinct assets detected |
| Per asset | Breakdown per asset with time, visits, and position pairs |
Total Time by Geofence chart — stacked horizontal bars. Green = active movement time, cyan = remaining time in zone. If accelerometer data is available, the chart shows both; otherwise just total time.
Outside Geofences — a virtual zone showing time between tracked positions that were not inside any geofence.
How time is calculated
Total time is the sum of intervals between consecutive position reports while the asset is inside a geofence. Gaps longer than 2 hours are not counted (the asset is assumed to have left). A zone must have at least two position fixes to appear. The last position's remaining time to the query end is included.
Active time vs Total time
Total time = time spent in the zone (from positions). Active time = accelerometer-detected movement, distributed across zones in proportion to time spent. Active time is always ≤ total time.
Trends & Analysis Tab
Understand usage patterns across days and hours.
KPI cards:
| KPI | Description |
|---|---|
| Total Active Time | Accumulated movement hours from accelerometer |
| Avg Active / Day | Average per day (only days with activity) |
| Busiest Day | Weekday with the highest average active hours |
| Peak Hour | Hour of day with the most activity |
Charts:
-
Daily Active Hours — bar chart with one bar per day. Color intensity shows relative activity (green = peak, yellow = moderate, gray = low). Cyan trend line shows direction. Tooltip includes asset count.
-
Which Days Are Busiest? — weekday averages (Mon–Sun). Identifies weekly usage patterns.
-
Hourly Utilization — accumulated accelerometer movement time per hour of day (0–23). Orange bars matching the energy dashboard style. Tooltip shows percentage of total.
Filters
| Filter | Effect |
|---|---|
| Time range | Last 24h, 7 days, 30 days, or 90 days |
| Asset Type | Select one or more types in the dropdown (empty = all). Multi-select with checkmarks. |
| Asset | Focus on a specific asset |
Configuration
Click the Configuration button (top-right) to open the settings modal.
Asset Types — checkbox grid matching the Cold Chain configuration style. Select types to filter the dashboard. Leave all unchecked for all types. Selection is persisted in your browser (localStorage) and remembered across page loads and tab switches.
Working Hours — define the weekly schedule used for utilization calculations:
- Configuration Name — label for this schedule (e.g., "Standard Shift")
- Day toggles — enable/disable each day (Mon–Sun)
- Shift times — start and end time per day (e.g., 08:00–16:00)
- Saved to the backend and shared across the organization
Working hours affect utilization %
Available hours = sum of enabled shift hours in the selected period. If no schedule is configured, a default 8h/day Mon–Fri is used.
Data Sources
| Metric | Source |
|---|---|
| Active / idle hours | Accelerometer movement_time_s from Wirepas sensor data (30-min gap threshold) |
| Total time in geofence | Position report intervals from rtls_positions (2-hour gap threshold) |
| Utilization % | Active hours ÷ available working hours from schedule |
| Positions | Wirepas mesh triangulation via anchors |